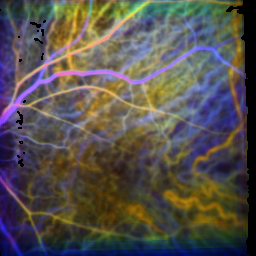
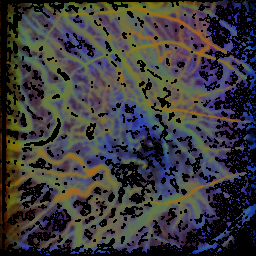
On this page, the colors in the images are normalized in each case to its own averaged influx behaviour, so the colors visualize for time differences within the means of recording. The recordings were made with 4 frames/second. Times are displayed in frames, a frame corresponds to each corresponding to a 1/4 second.
If you click on one of the pictures, you get each for an enlarged view of the picture.
|
time of the maximum: 26.5 f ± 19.6%visual acuity: 1.00 video |
 |
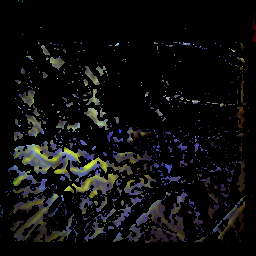
time of the maximum: 50.4 f ± 14.3%visual acuity: 0.30 video |
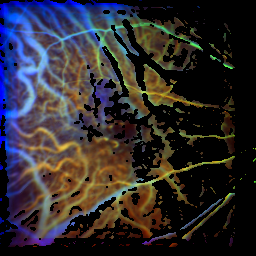
| before the first rheopheresis | after the first rheopheresis | after the third rheopheresis |
 |
 |
 |
| time of the maximum: 55.4 f ± 10.1%visual acuity: 0.50 video | time of the maximum: 53.3 f ± 14.5%visual acuity: 0.63 video | time of the maximum: 34.7 f ± 13.8%visual acuity: 0.80 video |
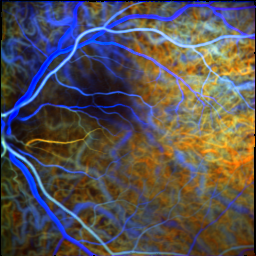
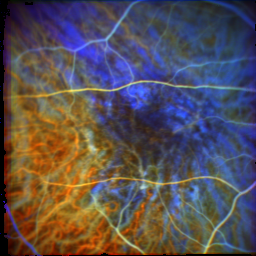
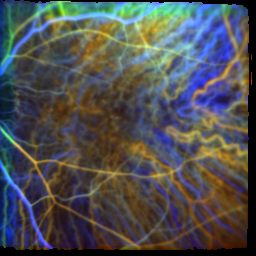
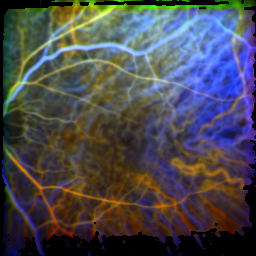
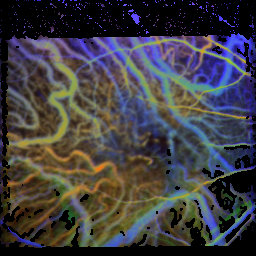
| before the first rheopheresis | after the first rheopheresis | before the third rheopheresis | after the third rheopheresis |
 |
 |
 |
 |
| time of the maximum: 93.6 f ± 17.3%visual acuity: 0.25 video | time of the maximum: 74.1 f ± 14.5%visual acuity: – video | time of the maximum: 52.4 f ± 10.1%visual acuity: 0.32 video | time of the maximum: 66.4 f ± 8.6%visual acuity: 0.20 video |
![]()